Most data analysts struggle to get their first job.
The reasons why they struggle are never-ending:
- Lack of clarity
- Not sure about specific skills to learn
- Not able to solve a painful problem
The list goes on and on…
Unfortunately, most data analysts don’t specialize early enough in their careers.
Python is the perfect tool for performance marketing analytics.
Here’s what I’d do if I were just starting with Python for performance marketing analytics (PMA):
- Find one specific problem to solve
- Create a plan to solve that problem with Python
- Compile your work into a project
- Publish to your online portfolio
By the end of this roadmap, you’ll understand how to get started solving marketing problems with Python.
Step 1: Find one very specific problem to solve
Notice I didn’t say “you need to know everything about marketing.“
Performance marketing covers a lot of areas, but here are four common categories.
- Social media ad campaigns
- Search engine marketing
- Influencer marketing
- Sponsored content
Most problems in PMA are related to “optimization”: optimizing ad spend, optimizing open rates, optimizing CTRs, etc.
For example, imagine you are helping a social media marketing manager figure out the best topic for a Twitter ad campaign.
This is a very specific problem that you can solve with Python.
Step 2: Create a plan to solve that problem with Python
Learning Python is hard because it’s boring to just learn.
A much better way is to actually solve a real problem with Python and learn along the way.
Now that we have our very specific problem to solve, let’s figure out how to get from Point A to Point B easily, quickly, and without getting lost.
- Collect the data
- Analyze the data
- Look for insights
- Present your results
Let’s break down the plan:
Collect the data
There are many ways to do this, but we’ll keep it simple for now and use some fake Twitter data. Download this dataset to your computer.
Analyze the data
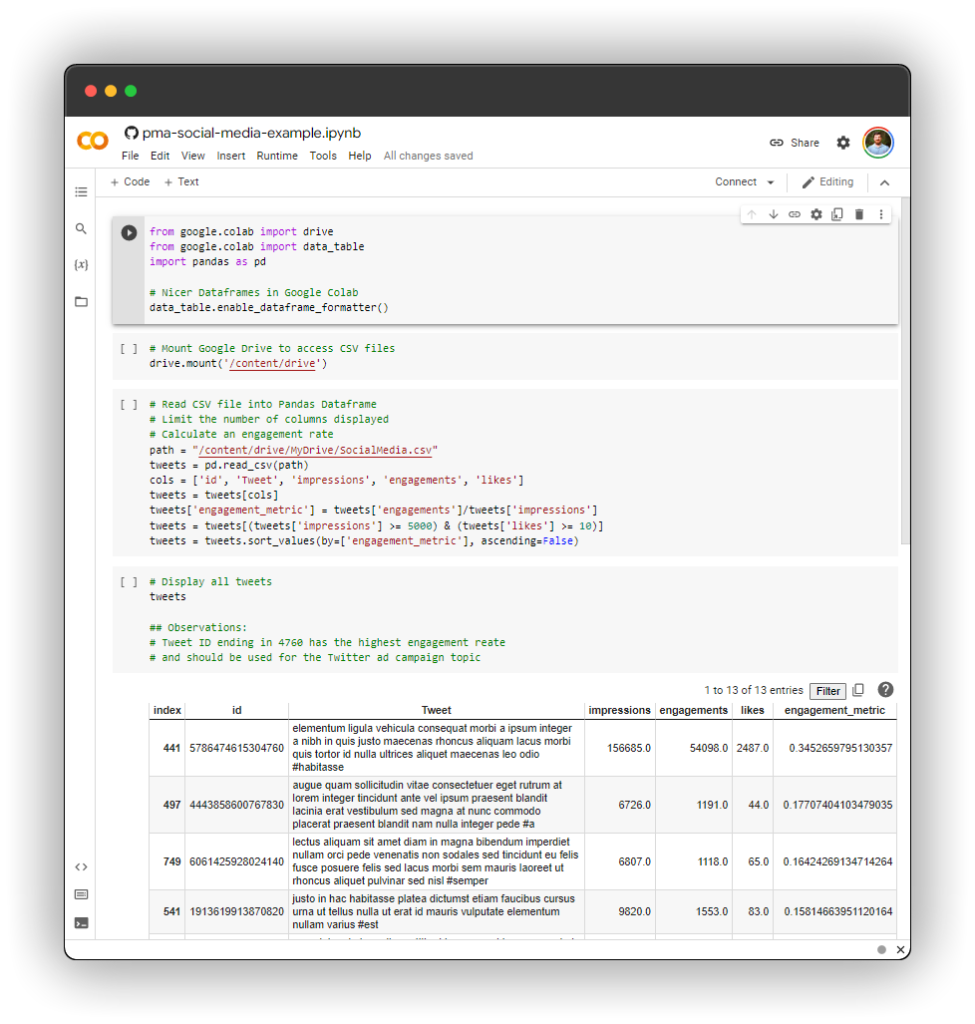
The next step is to analyze the data using Python.
- Use a Jupyter notebook to load the data
- If you’re not familiar with Jupyter, I recommend starting with Google Colab
- Use the
pandaslibrary for exploratory data analysis
Here’s a copy of my notebook for you to get started:

Look for insights
After you’ve loaded the data into Jupyter and analyzed the data, start looking for insights
- Create an engagement metric to see how all Tweets performed (see my code above)
- Pick the top tweet by engagement for the Twitter ad campaign
Present your results
Finally, you are ready to present your results.
- Create a quick write-up using the 1-3-1 writing framework
- Come up with 3 options and 1 recommendation
- Send that to the social media marketing manager
These are the exact steps you’d follow in a real-world scenario.
Let’s finish by compiling everything into a portfolio project.
Step 3: Compile your work into a project
Most people skip these last two steps – but they are important.
By compiling all of your work into a final package, you have a final product that can be shared with the world in your data analytics portfolio.
Here’s how:
1) Provide a conclusion to your analysis
Your analysis should have a clear conclusion based on your findings and be backed up by the data.
Example of a good conclusion: “The best topic for the next Twitter ad campaign is Topic X because Tweet ABC had the highest engagement in the past Z weeks.“
2) Create a project write-up
Next, you’ll want to create a project write-up.
Use the STAR Framework for this. Here’s an example:
- Situation: “The Social Media Marketing Manager needed to know what topic their next Twitter ad campaign should be about and came to me for help.“
- Task: “I was responsible for analyzing past Twitter performance marketing data and recommending a topic.“
- Action: “I collected and analyzed the data using Python, developed an engagement metric, and found the best topics for future Twitter ad campaigns.“
- Result: “Based on my analysis, the Social Media Manager was able to quickly develop future marketing campaigns that would drive engagement and perform well with our target demographic“
3) Collect the supporting materials
Part of any good Python project is packaging up everything so you have it for future reference.
- Your CSV files
- Your Jupyter notebooks
- Your write-ups
- Your Tableau workbooks
All of these supporting materials can be used later. They also come in handy if you need to retrace your steps or tweak your original analysis.
This step might seem pointless, but it’s critical to keep your work organized to consistently deliver high-quality results.
Step 4: Publish to your online portfolio
Your online data analytics portfolio sends a signal: you know how to solve problems with data.
By following this guide, you’ve shown that you can solve a very specific performance marketing problem using Python.
This approach is the best way to stand out during the job interview process.
The final step in this roadmap is to publish everything to your online data analytics portfolio.
1) Log into your portfolio site
If you haven’t got an online portfolio yet, check out my guide: How to Host Your Online Data Analytics Portfolio for Free
2) Create a new portfolio entry
Be sure to include these elements:
- Screenshots of your work
- Your STAR Framework write-up
- Links to your project files
These elements will fill out your portfolio.
3) Hit publish!
Now that you’ve added a new project to your portfolio, you are ready to share it with the world.
Be sure to tag me on Twitter @NewPrediction for everything you build in public.
That’s it!
Master these 4 skills to develop your expertise as a performance marketing analyst using Python.
- Find one specific problem to solve
- Create a plan to solve that problem with Python
- Compile your work into a project
- Publish to your online portfolio
Now, repeat these exact steps again and again until you have 3-5 projects built up in your data analytics portfolio.
See you again next week!
Interested in starting with data?
Whenever you’re ready, there are 2 ways I can help you:

Fantastic Data analysis guides
Thanks
Thanks, Eman!
Pingback: The Six Figure Data Analytics Tech Stack: The Tools You Need To Succeed In Data (And How To Learn Each One) - New Prediction