Today, I’m sharing the exact step-by-step process to host your data analytics portfolio for free.
By using this guide, you will be able to get your data analytics portfolio up and running without spending a dime. You will be able to share your portfolio with the world. And with recruiters and hiring managers for your next interview.
Unfortunately, many beginner data analysts waste a lot of time and money trying to get their portfolios online.
- Using amateur-looking platforms like Google Sites
- Using clunky sites like Kaggle and GitHub
- Procrastinating because it’s too hard
Your online data analytics portfolio sends a signal: “I can solve problems with data.”
Recruiters and hiring managers know what they are looking for.
- Professionals that can work with data
- Analysts that know how to think
- Sample work to show skills
Fortunately, if you know how to get your portfolio online, you can be ahead of the crowd.
Here’s how to get your portfolio online, step by step:
1. Sign up for a free carrd.co account
Carrd.co is my recommendation for hosting your online data analytics portfolio.
- Free and easy to use
- Professional templates
- Has everything you need
Don’t be tempted into thinking you have to have your portfolio on GitHub or Kaggle. Those sites are awesome! But they aren’t great for hosting your portfolio.
Those kinds of sites are made for hosting code, building communities, and collaboration.
Of course, if you have code samples or specific Kaggle work you want to showcase you can include links and screenshots.
But your online data analytics portfolio site should be clean and professional looking.
Note: You will get a your-name.carrd.co domain name on the free plan. If you want to upgrade to get your own domain name, it’s just $19 per year. That’s completely optional though. This guide shows you how to get started for free.
2. Use a portfolio template
Use a professional-looking template that matches your personality. There are pre-made portfolio templates so that you can have something that looks great but requires no design effort on your part.
This is the beauty of using Carrd.co. You can focus on your work without having to waste time on design.
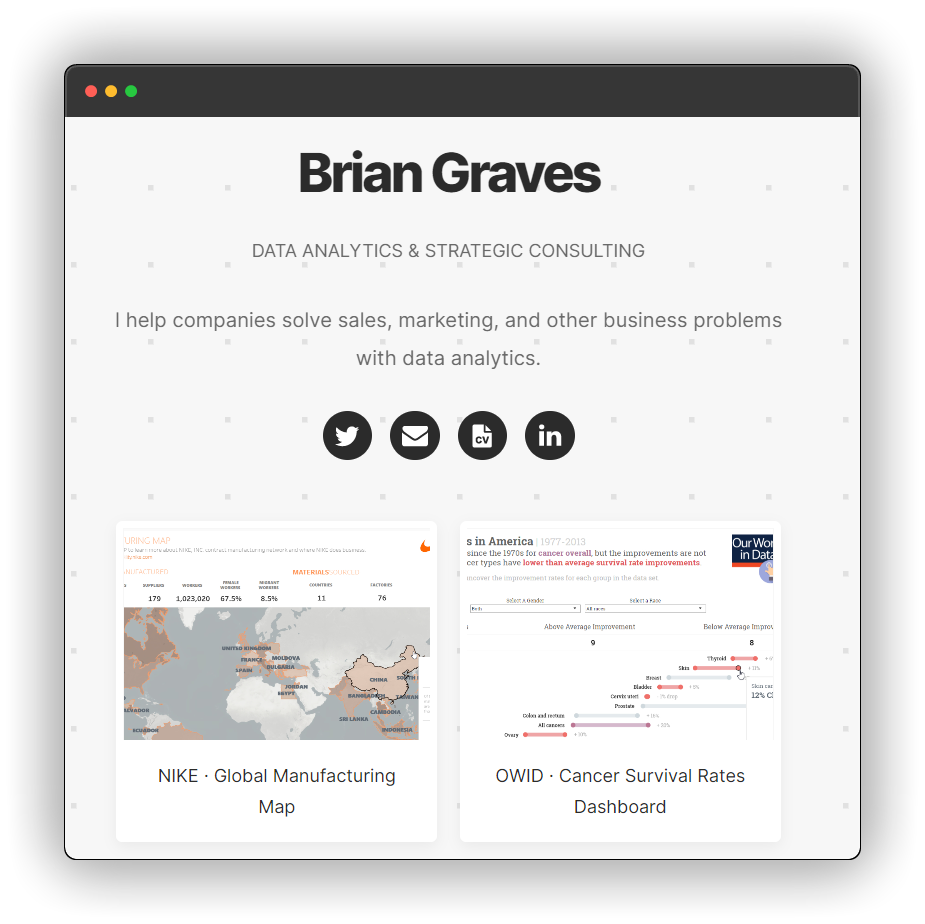
Here’s the one I used. It doesn’t matter the exact template you use, as long as it’s professional.
Carrd.co has a lot of ready-made portfolio templates built into the tool
You can also find templates online:
The main thing is that you don’t want to have a lot of clutter. Keep it simple so that recruiters and future employers can focus on your work.
If you want something that looks a bit nicer, there are also paid carrd templates you can pick up for a small fee.
Other things to include on your portfolio
- Social media links like LinkedIn or Twitter
- Link to email
- Link to resume or CV
Just to get started, keep it simple for now so you can show your best projects.
3. Pick your projects
You want to show your best work in your portfolio.
If you’ve been studying data analytics and have been working through courses, you should have a few example projects that you’ve created along the way.
I recommend picking your top 4 or 5 projects to include in your portfolio.
The best projects you can pick:
- Are business-focused, not hobby focused.
- Clearly show data analytics best practices.
- Show the skills for the job you want.
If you are applying for a job or looking to get freelance work, your portfolio MUST be business oriented. Sure, have fun with your Pokemon data set or sports visualization, but they have to show a real business scenario.
Now, if your industry is sports analytics then building a sports visualization is fine. But stay away from anything that’s strictly a hobby.
Examples of projects that work great in your portfolio:
- Marketing analytics: marketing funnel, campaign optimization, or customer review analysis
- Healthcare analytics: patient dashboard, budget planning report, insurance scorecard
- Business analytics: call center, social media, supply chain analytics
No matter what industry you want to work in, make sure your work focuses on that industry where possible.
Use visualizations whenever possible
A wall of SQL code might get the job done, but it won’t look great in your online data analytics portfolio.
Your projects should have some visual element to it.
- Use Tableau Public (free) to visualize your data in a drag-and-drop interface
- Use Jupyter Notebooks to use a Python data visualization library
- Build an Excel dashboard using a business data set
Once you have 4-5 projects that have a visual element, take a screenshot and add it to your carrd portfolio.
You can include a brief description and link to a full version (like Tableau Public if you are using that tool)
Once you have your images uploaded and linked, you are ready to publish and share.
Here’s what mine looks like:
4. Publish your portfolio
Now that you have your projects added, it’s time to publish!
Add any finishing touches, like colors, fonts, or background images. Remember to keep it professional. You don’t want recruiters getting distracted or overwhelmed.
You want them to focus on your work.
When you’re ready pick a subdomain name (yourname.carrd.co is perfect!) and you’re done!
5. Share your online data analytics portfolio with the world
Congratulations! You’ve now got an online data analytics portfolio ready to share with the world!
The first step is to share it with me on Twitter @NewPrediction
Here’s a link you can use. Be sure to add your link where it says YOURLINKHERE
Other places you can share your portfolio
- Messaging apps like WhatsApp and Telegram
- Social media, Twitter, and LinkedIn bio
- At the top of your resume or CV
- At the bottom footer of every email you send
- Business cards, websites, and letterhead
Most of all, you’ll now be able to share it with recruiters and hiring managers during the interview process!
Next steps
- Sign up for carrd.co
- Create and publish your online data analytics portfolio
- Share it with me on Twitter @NewPrediction
- Share it with the world!
See you again next week!
Whenever you’re ready, there are 2 ways I can help you:
- How To Create An Awesome Online Data Analytics Portfolio is my complete guide to creating an attention-grabbing portfolio in 14 days (pre-order now, launching Oct 2022)
- Need specific advice? Book a 1:1 session with me.