
The first time I had to present some analysis to a senior executive at my company, I was totally petrified.
I had no idea what made a “good” analysis and what made something “bad”.
While I know I included a chart or two in the presentation, I’m sure that I didn’t follow basic data visualization best practices.
You could say that I was completely winging it. Not good.
If I had a tool like Tableau back then I would have been set.
I did the best I could with the skills, knowledge, and tools I had at that time.
But with the step-by-step guide below, you can avoid all of the embarrassing mistakes. (I actually put together a PDF checklist that you can download below)
Instead of feeling inadequate or like you’ve missed something obvious, you can be confident with the skill you’ll learn in this guide.
You won’t have to be worried (like I was) that your boss or manager will ask you to slice and dice some numbers and then not even be able to answer that basic question.
Tableau is great for working with data quickly and easily. This guide shows you the best way to get up to speed with Tableau…fast.
In this step-by-step Tableau tutorial for beginners you will learn:
- 5 super specific examples of what you can improve in your Tableau projects
- How to recreate a graph in Tableau to impress your coworkers and colleagues
- The best way to share your work with others so you can get feedback and avoid embarrassment
Here’s what you are going to be able to do by the end of this guide
Part #1: Quick Fixes
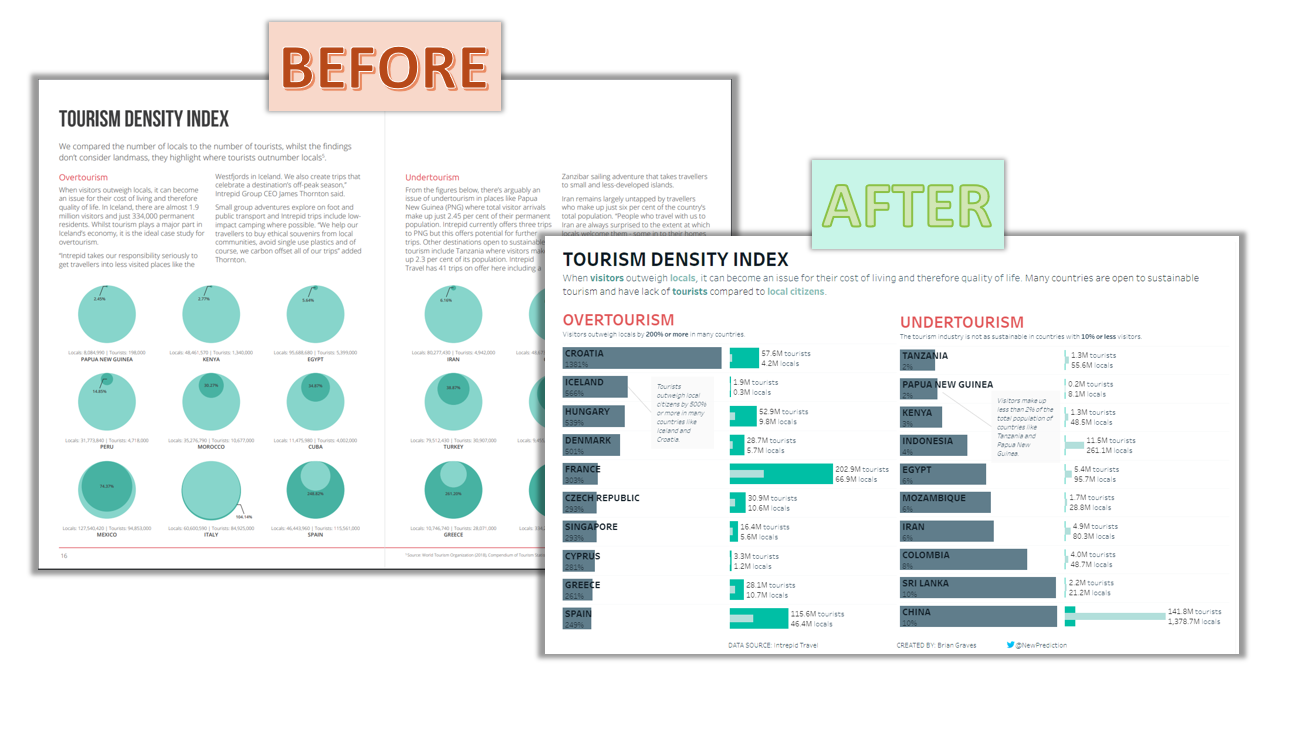
The first thing to do is identify a few problems with an existing chart. I’m going to show you the exact process I go through.
Thing #1 that needs to be fixed with the original chart in my example:
Country comparisons

Trying to compare the countries here was very hard because the circles were so far away from each other.
Plus, circles are just harder to compare period.
You’ve gotta consider the area and all of that math stuff which I’m not great at…
For example, with a circle, it’s pretty tough to see if something is 25% bigger or 35% bigger.
Much easier to compare the countries with a bar chart so that’s what I did
Thing #2 that needs to be fixed:
Not highlighting the most important metrics

The entire point of the original chart is the percentage of local citizens to visitors in a particular country. Okay got it.
But the chart here from Intrepid Travel (I’m sure they are awesome people!) completely hides that key piece of data.
Here’s what I mean
In the screenshot above, you can see that the number are super duper tiny. This is the MOST important metric in the whole thing. Not good.
But in the after screenshot, I actually went ahead and made that index percentage front and center.
I used that index percentage number for the length of the bar chart and put the number on the label, too.
Again, this is the most important piece of information for this chart, so it’s worth hitting people over the head with it.
Thing #3 that needed to be fixed:
Using super-precise data when it’s not needed
This one might seem like I’m nitpicking. But I’m not.
Most people want to glance at a graph or a chart and get the gist pretty quickly.
They do NOT want to burn calories on understanding your data.
Well, I’m telling you that getting down to “Census Beaurau” (I can never spell that word, btw) level accuracy just isn’t needed most of the time.
Even worse, it’s exhausting for your audience and distracts from the broader point.
So, I rounded all of the numbers in Tableau. Takes about 7 seconds and really makes the entire thing easier to read.
Thing #4 that needed to be fixed in this original chart:
Confusing color scheme
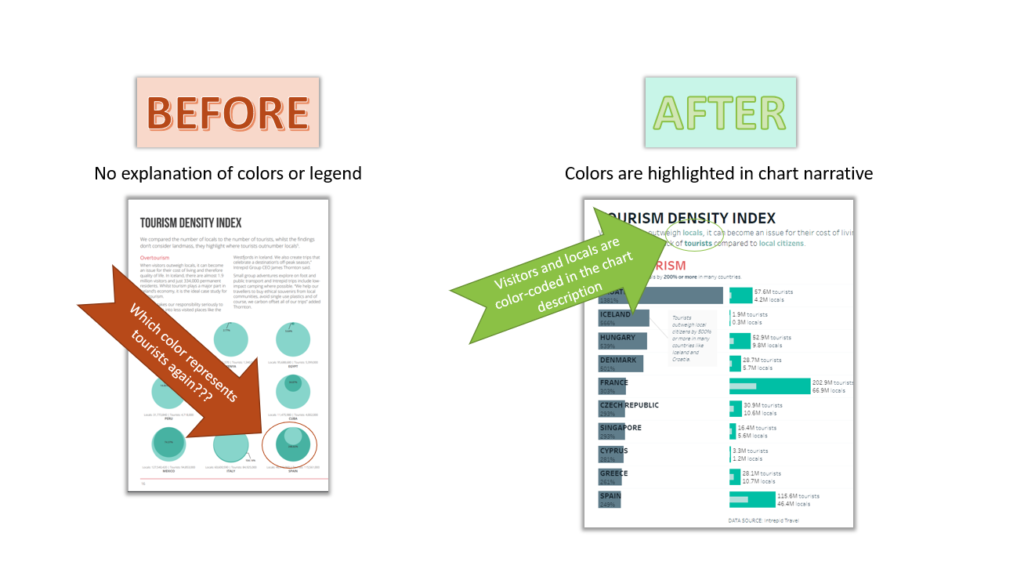
This one is somewhat minor because there were really only two colors.
But I was honestly getting lost trying to keep which color (dark green or light green) belong to which type of person (visitor or local citizen)
Now, I’m not a big fan of separate color legends although some people are and that’s usually okay.
What I like to do is embed the colors into the visualization somehow.
Take a look at the screenshot above to see what I mean.
Thing #5 that I fixed in this chart:
Mismatched countries and categories
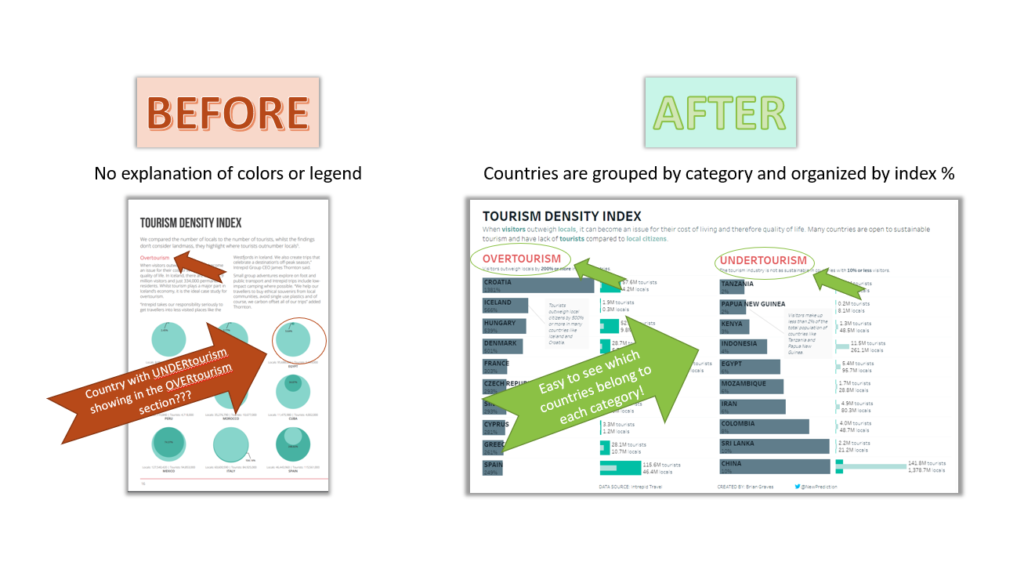
For this fix, I simply created two different Tableau worksheets (one for each tourism index category) so that they were grouped together.
The original chart seemed to have them mixed together, I’m not sure exactly why.
As you can see below, my updated chart created with Tableau makes it super easy to understand what the reader is actually looking at.
Final Before and After shot of my Tableau recreation

Okay, so that was step 1: identifying issues with any data visualization. Maybe it’s your chart from 6 months ago. Maybe it’s your coworkers. Heck, maybe it’s MINE! 🙂
So let’s get on to the fun part already. In Step #2, I’m going to show you the step-by-step method to fix this busted chart. Let’s roll!
Part #2: Make the Chart Look Awesome in Tableau
There are 7 steps to create the entire chart from scratch.
STEP 1 Connect to the data
– The data is hosted on data.world so sign up if you need to.
– Connect to the data source in Tableau
https://tableau.data.world/?dataset_name=makeovermonday/2018w24-tourism-density-index
– Open the sheet when you are ready to get started!
STEP 2 Create 3 calculated fields
– “Category Upper”: UPPER([Category])
– “Country Upper”: UPPER([Country])
– “Locals Outnumber % Round”: ROUND([Locals outnumbered by tourists by %],2)
STEP 3: Set default properties for all fields
– “Locals” and “Tourists” fields: Number (Custom) > Decimal Places: 1 > Display Units: Millions (M)
– “Index % fields”: Number: Percentage > Decimal Places: 0
STEP 4: Create the bar charts
– Columns card: Locals Outnumber % Round, Number of Tourists and Number of Locals measures
– Set dual axis for Number of Tourists and Number of Locals measures
– Rows card: Category and Country dimensions
– Set the chart types to bars and adjust the colors
STEP 5: Add filters and adjust the axis
– Filter by Category to show only Overtourism countries
– Sort country by Locals Outnumber % Round
– Expand the chart so it fills the whole screen
STEP 6: Add and format labels and axis
– Adjust the bar chart sizing and positioning to make sure that everything is visible
– Labels shouldn’t overlap each other or the bar chart
– Make sure that the axis is synchronized
STEP 7: Create the dashboard
– Add the chart titles and adjust the formatting
– Add the Overtourism worksheet to the left side
– Add the Undertourism worksheet
– Remove any legend boxes that are added automatically
– Remove grid lines and borders
– Add annotations to marks (as needed)
– Add a text section at the top for the chart title
Part 3: Share What You’ve Made with Someone You Care About
Since this part is so quick, all of the steps are in one animated gif 🙂
If you want to share your work with the world (and build your Tableau portfolio at the same time). Follow these steps.
Step 1: Sign into your Tableau public account in Tableau. Create one for free if you don’t already have one.
Step 2: Publish your creation.
Step 3: Gather feedback and adjust your chart as needed. For example, you’ll notice that I forgot to clear out the tooltips in my video walkthrough so I did that AFTER publishing. Easy!
BONUS STEP: Shoot me a quick tweet about your creation. Include a screenshot of your chart and a link to the Tableau Public workbook. Connecting with other Tableau #DataPeeps is always great!
Tableau Tutorial Youtube Walkthrough
Watch me work through all of the details to rebuild this chart from scratch in Tableau
Conclusion
Fixing a chart with Tableau is a great way to show off your skills and impress the people you work with.
Just be sure to follow these basic steps as a guide to help you avoid making mistakes or being afraid to present your work.
Here’s what you learned:
Part 1: Find a Few Things that can be Fixed Quickly
Part 2: Make the Chart Look Awesome in Tableau
Part 3: Share with Someone You Care About