Tableau is a great tool for quickly looking at your data, but it requires a different way of thinking about your data and visualizations. Many people are used to working a certain way with specific tools and then can’t quite figure out how to use Tableau in the same way.

Here’s a list of five mistakes that you can avoid when getting started with Tableau so you don’t waste time or get frustrated.
Tableau Beginner Mistake #1: Trying to recreate reports built with another tool
Most people get frustrated when they start using Tableau because it doesn’t work like Excel, or Access, or PowerPoint.
Here’s the thing…
If you can learn to think with Tableau, you’ll be less frustrated.
For example, Tableau isn’t great at “pixel perfect” reports. So, if you have a very specific format that is required for certain reports, you may need to resort to other tools to achieve that goal.
Just follow these steps to avoid wasting time and getting super frustrated.
- Create a new Tableau sheet based on the data set you’re working with
- Position the data according to the required template layout
- Copy and paste the data from each sheet into your template files (Excel, Powerpoint, or whatever)
Watch how to avoid getting frustrated with this mistake:
Tableau Beginner Mistake #2: Showing everything on one dashboard
It’s tempting to create a dashboard that’s great for everyone in your organization. But, if you do that, you’ll end up building something that’s great for no one in your organization.
Think about it…
You’ll likely have people with very different technical skills using at your dashboards at different times for different purposes. Why would you try to build a one-size-fits-all solution? It just doesn’t make sense, but most beginners make this exact mistake.
Instead, think about the story you want to tell and guide the end user along a path that tells that story.
For example, if you have a lot of sales data for your organization, you probably want to include everything (just in case a question comes up that you haven’t thought about…).
Here’s what you should do instead:
- In Tableau, create a detail page that shows the lowest level data in one sheet
- Use custom actions so that your users can click into your detail sheet, if they want to.
- In Tableau, find the dashboard page you want to add a new custom action to
- Select Dashboard then Actions
- Click Add Action then Filter
- Name your new Filter Action Customer Details
- In the Target Sheet section, use the drop down to select the sheet you created in step 1 above
- Click Ok and then Ok again to get back to the dashboard page.
- Make sure the custom dashboard action works as expected
- Select one of the customer records to get the menu to appear
- Click the Customer Details link to view the detailed information
Check out the step-by-step tutorial below
Beginner Mistake #3: Relying on Tableau for complex data blending
If you aren’t familiar with data collection and ETL best practices, it can be tempting to use Tableau’s super powerful data blending functionality to combine all sorts of data into one analysis.
Here’s the catch…
Tableau does it’s best to combine data sources, but it can sometimes lead to unexpected or inaccurate results. Also, your dashboards will run very slowly if data is not blended together properly..
Instead use this step-by-step approach to blend your data quickly and avoid unexpected results
- Take a look at each data source and identify a common field or “key”.
For example, customer name or customer ID. - Make sure that each data source doesn’t have missing values or duplicate values for that common key
- Add your secondary data source to Tableau
- Join the data sources using the Data – > Edit Relationships command using the common key you’ve identified.
- Analyze the results so far to make sure you are getting the expected results.
- Add more data sources and join on the key, confirming that your data is accurate after each additional data source is added.
Tableau Beginner Mistake #4: Going overboard with the formatting
There are millions of options with Tableau for formatting your dashboards. However, you should stick to the defaults wherever possible.
Most people don’t realize…
Tableau employees have spent hundreds of thousands of hours finding the perfect colors, fonts, and formatting that work just fine 99% of the time. Why take the time yourself?
Tips for formatting in Tableau
- Stick with the Tableau default fonts, colors, shapes, and field formats whenever possible
- Use consistent formatting throughout the entire dashboard
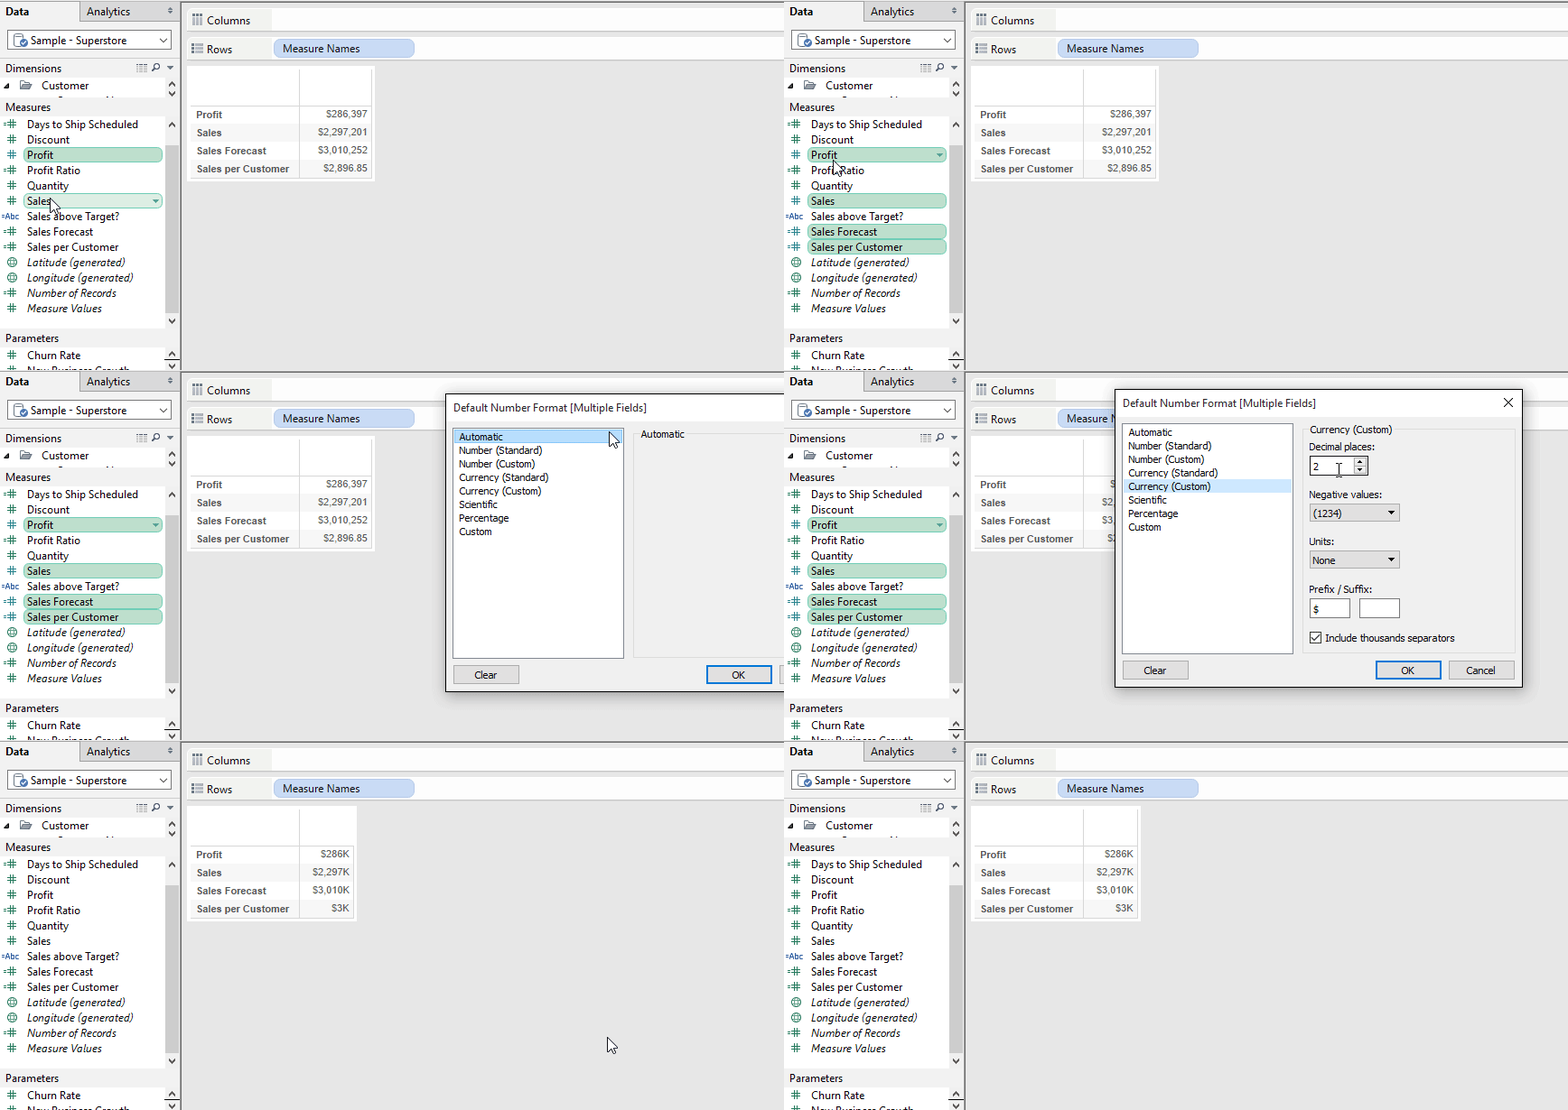
- Format multiple fields at once by pressing CTRL and clicking each field (see below for a visual guide)
- Simplify date/time field formatting by removing hours, minutes, and seconds
- Simplify currency field formatting by rounding to the nearest dollar
- Use unit formatting to round to thousands, millions, or billions

Tableau Beginner Mistake #5: Connecting to summarized data
Whenever possible, you want to connect to raw data in Tableau. You do not want to connect to summarized or aggregated data.
Here’s why:
Tableau (like every piece of software ever…) is really dumb. If you have a nice report built in Excel, you might want to just “import” that into Tableau and build from there. But that’s the wrong approach. If you connect to the raw data then you can build something even better in Tableau.
How to work with Excel data in Tableau if you don’t have the underlying raw data
- In Excel, remove any extra rows or columns that don’t include data you care about seeing in Tableau
- Rearrange the data so that there’s only one piece of data in each row
- Make sure that header fields are only in the first row of your data. Remove extra header fields.
- Fill in missing or empty data cells or header fields.
- Clean up extra rows like grand totals, subtotals, etc. Just get rid of them.
- Use the data reshaping tool if you need to manipulate data for Tableau (useful for monthly trend data, categories, etc.)
For example, Steve at DataRevelations.com has a great example of working with survey data in Tableau. Check out the workflow that I created based off of his guide.
Mistakes to avoid if you are a Tableau Beginner
Let’s recap everything we’ve learned about avoiding beginner mistakes with Tableau
In this video series, you have learned:
- The right way to use Tableau and templates together
- How to prevent “information overload” with Tableau dashboards
- Mistakes to avoid while blending data in Tableau
- 6 tips for easy formatting in Tableau
- Step-by-step instructions to “reshape” your data for Tableau
In the comments below, share something that tripped you up when you were getting started with Tableau.

Can you please explain what you mean when you say this:
3. Make sure that header fields are only in the first row of your data. Remove extra header fields.
This is about when we feed data in excel, right?
You are correct. This is about the data you are connecting to in Tableau.
My point here is that some Excel files have extra rows at the top of the file that will mess up in Tableau. If you don’t have that problem then you don’t need to worry!
Thanks for checking!!
Pingback: Tableau Line Charts: The Ultimate Guide - New Prediction