Data visualization books are a quick way to improve your next data visualization project.
Imagine making one simple tweak to your next presentation, dashboard, or report and get an instant response from your coworkers or your boss.
In this guide, I’m going to share my top 3 takeaways for four “mind-blowingly awesome” data visualization books. 🤯
I’ll also include what OTHER people have to say about each of the books.
Here’s the thing: there are TONS of data visualization books out there including free data visualization books. The problem is that it takes a lot of time to figure out where to start.
But you can get any book listed below and take action today. I’ve provided the three big ideas for each book along with the 1 thing I like the most to get you started without feeling overwhelmed.
Data visualization books for you
- Storytelling with Data by Cole Nussbaumer Knaflic
- Effective Data Visualization by Stephanie Evergreen
- The Big Book of Dashboards by Steve Wexler, Jeffrey Shaffer, and Andy Cotgreave
- Information Dashboard Design by Stephen Few
Please note: I do earn a small commission if you use any of the Amazon links in this post. It costs you nothing, but gives me a few cents if you end up purchasing the book based on this guide.
Data Visualization Book #1 – BUY NOW
Storytelling with Data: A Data Visualization Guide for Business Professionals
Author: Cole Nussbaumer Knaflic
Amazon Links: Book | Audible | Kindle
My three main takeaways for “Storytelling with Data”
- Great overview of data visualization and why it’s so important
- The content works for pretty much every industry
- Includes in-depth 5 case studies so you can see behind the scenes
The best part of this book for me
This book covers the basics of data visualization best practices and ALSO how to put them together to build a story that will actually get you results FAST.
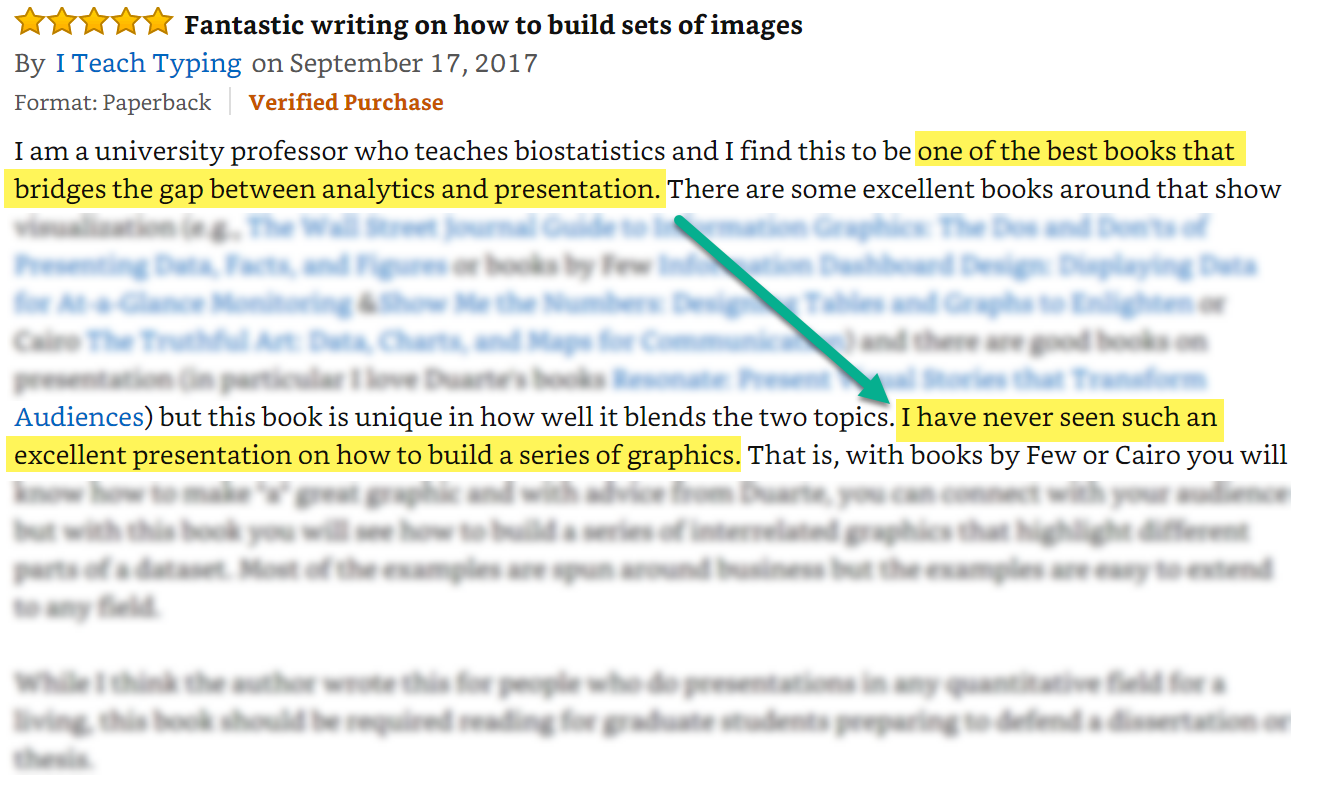
Great Amazon review
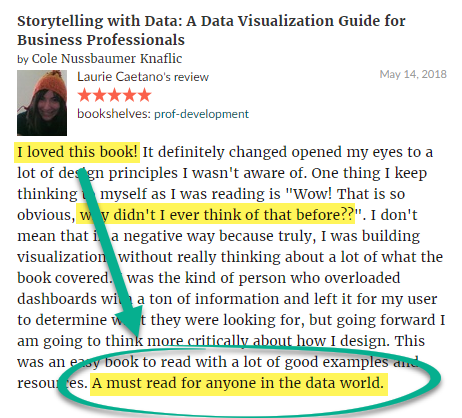
What one reader said on Good Reads
Facts and figures for “Storytelling with Data”
Number of Pages: 252
Amazon Score: 4.6
Number of Amazon Reviews: 257
Good Reads Score: 4.38
Number of Good Reads Ratings: 944
Number of 4- & 5-Star Ratings on Good Reads: 832
Book #2 – BUY NOW
Effective Data Visualization: The Right Chart for the Right Data
Author: Stephanie Evergreen
My three main takeaways “Effective Data Visualization”
- Awesome “Chart Chooser Cheat Sheet” showing dozens of visualization examples that will work for your data
- It will help you visualize complex statistical concepts (from ugh…to yay!)
- Great structure for each section with learning objectives,exercises, resources, and references for each topic
The best part of this book
It shows the exact chart type that will work best for you based on the kind of data you have and exactly what you want to do with it.
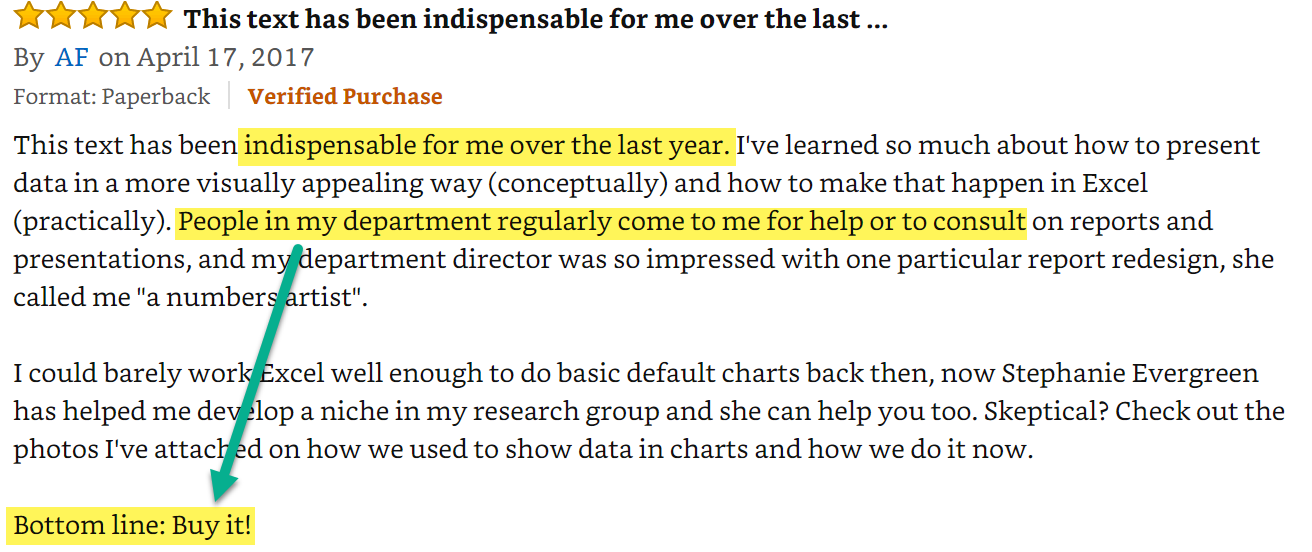
Someone on Amazon had this to say…
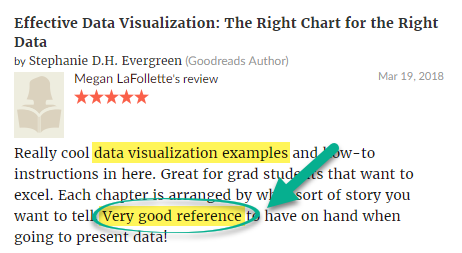
This was a great Good Reads review!
Facts and figures for “Effective Data Visualization”
Number of Pages: 262
Amazon Score: 4.4
Number of Amazon Reviews: 52
Good Reads Score: 4.04
Number of Good Reads Ratings: 67
Number of 4- & 5-Star Ratings on Good Reads: 52
Book #3 – BUY NOW
The Big Book of Dashboards: Visualizing Your Data Using Real-World Business Scenarios
Authors: Steve Wexler, Jeffrey Shaffer, and Andy Cotgreave
Three main takeaways for this book
- The “scenarios” section provides a quick guide to solve dozens of specific business problems
- Many different industries are covered and provide inspiration for your own daily work
- Each example includes author commentary to help you understand why each dashboard works
The best part of “The Big Book of Dashboards”
This book includes a scenario section with specific details, big picture overview, example use cases, and even related scenarios for each dashboard.
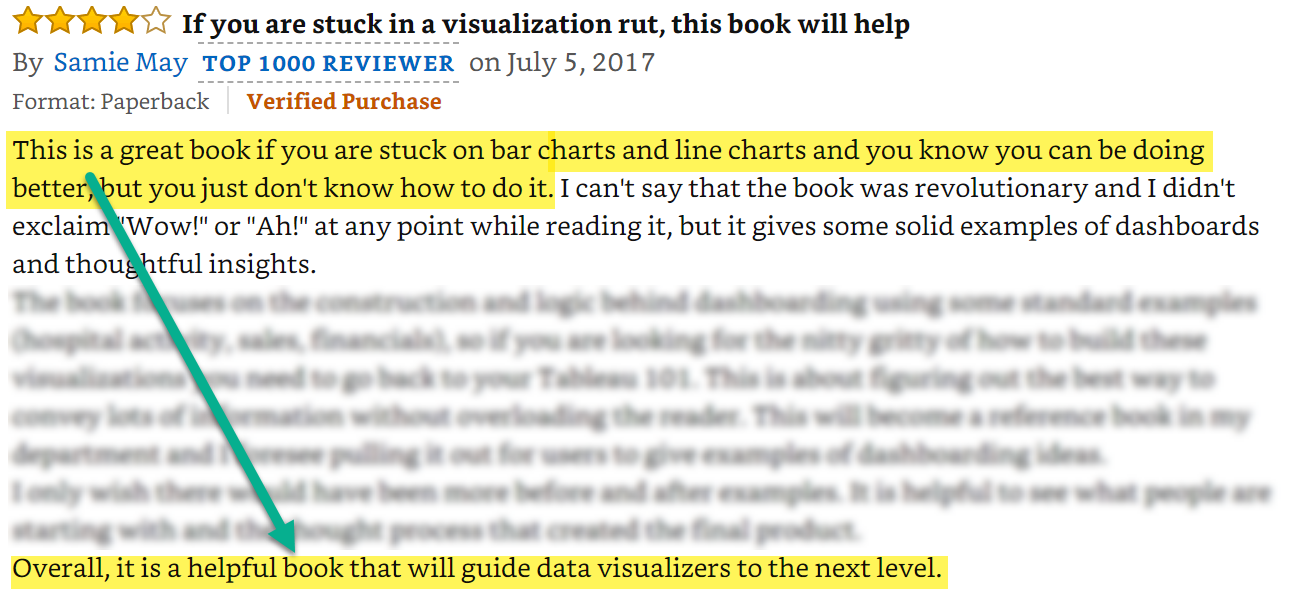
One Amazon customer in particular…
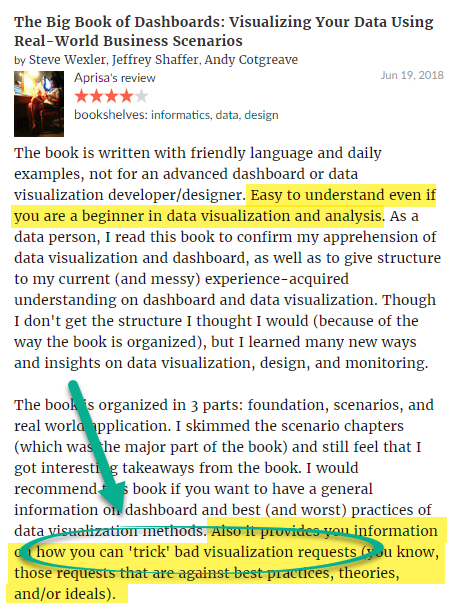
A recent 4-start rating on Good Reads:
Facts and figures for The Big Book of Dashboards
Number of Pages: 448
Amazon Score: 4.4
Number of Amazon Reviews: 49
Good Reads Score: 4.24
Number of Good Reads Ratings: 62
Number of 4- & 5-Star Ratings on Good Reads: 55
Book #4 – BUY NOW
Information Dashboard Design: Displaying Data for At-a-Glance Monitoring
Author: Stephen Few
Amazon Link: Hardcover Book
Three main takeaways for this book
- Bad dashboards are easy to create but getting them right can have a big impact on your organization
- This book is more like a college textbook. It’s filled with theory and philosophy with 1-2 pictures to illustrate an examples.
- It’s less expensive than the other books I’ve reviewed here and a great value. You can’t go wrong with this book!
My favorite part of “Information Dashboard Design”
I really liked the dashboard contest part of the book where Stephen dissected the top 2 or 3 dashboards of the 90 that were submitted. All the dashboards were created using the same data set. I really liked the winning dashboard!
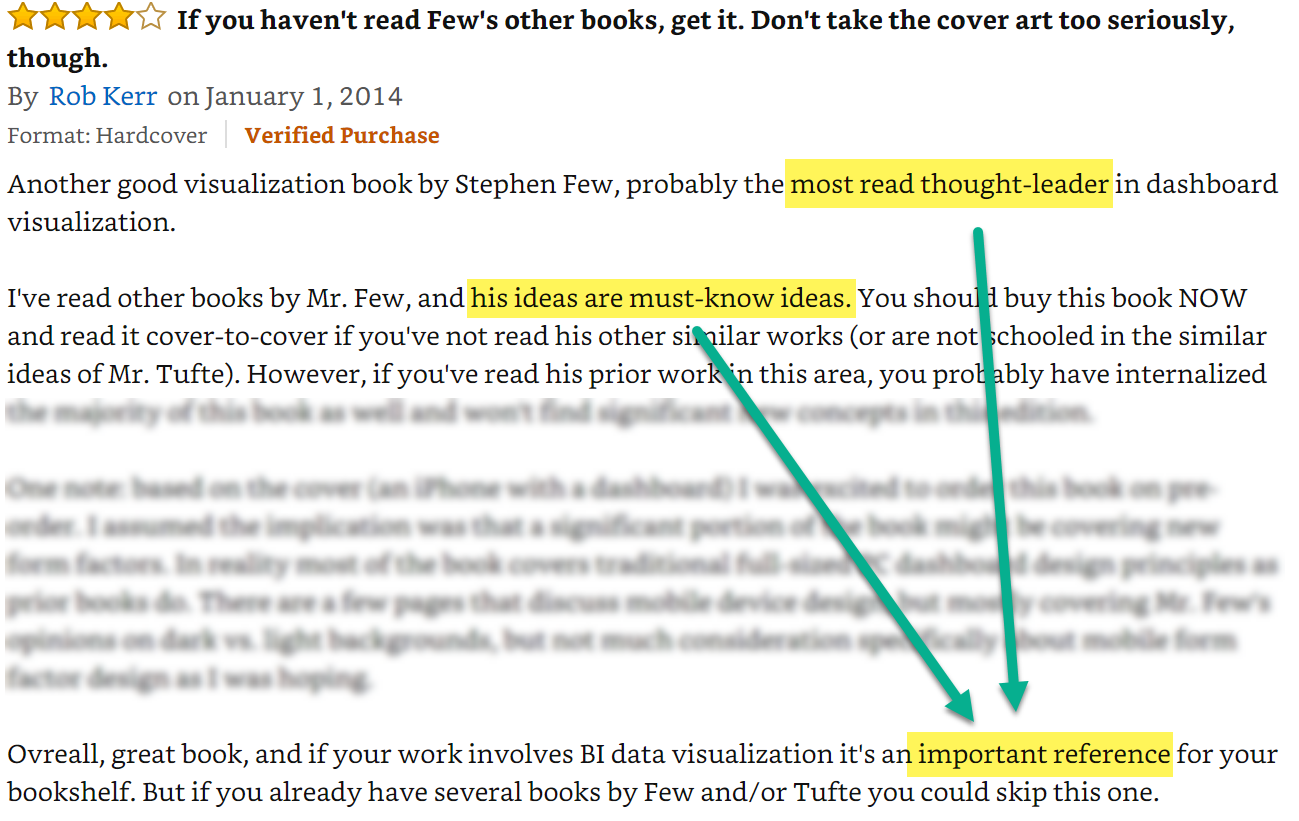
Check out this specific Amazon review…
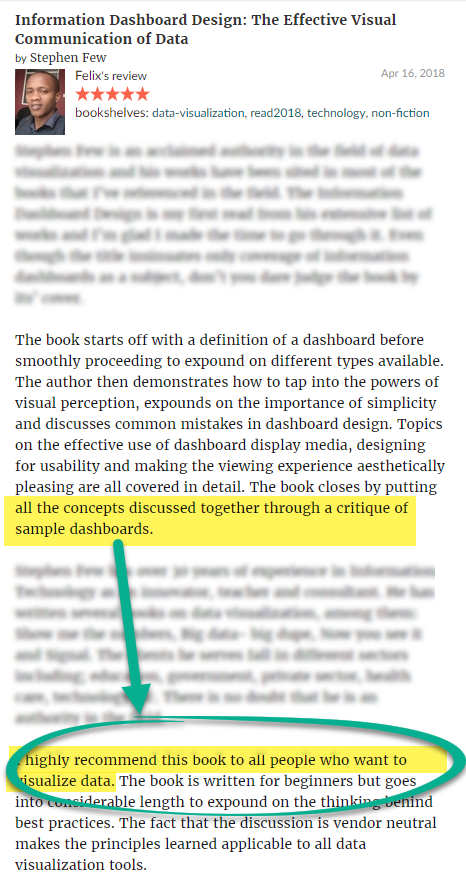
…and a nice 5-star review on Good Reads!
Facts and figures for Information Dashboard Design
Number of Pages: 260
Amazon Score: 4.4
Number of Amazon Reviews: 59
Good Reads Score: 3.98
Number of Good Reads Ratings: 1,377
Number of 4- & 5-Star Ratings on Good Reads: 1,001
Conclusion
In this guide, I covered 4 awesome data visualization books with key takeaways and a few customer reviews to help you decide which one is best for you.
Quick recap:
- If you are just getting started or if you don’t work with data very often, get Book #1 (Storytelling with Data | Amazon Link) or Book #2 (Effective Data Visualization | Amazon Link).
- If you are more experienced and looking for dashboard design tips and tricks, get Book #3 (The Big Book of Dashboards | Amazon Link) or Book #4 (Information Dashboard Design | Amazon Link)
In the comments below:
What’s 1 book you think I should add to the list?
Thanks for sharing the data visualization book list. Actually, I am also in the same niche and wanted to improve my data visualization skillls.Your guide would definitely help me to increase my knowledge. Once again thanks for sharing it
Glad you enjoyed the list! Good luck on your journey and let me know if there’s anything I can do to help!