Today, I’m sharing the 10 skills that employers are looking for in data analysts.
Including these skills in your online data analytics portfolio projects sets you apart from the crowd during interviews. Use this guide as a checklist and you can’t go wrong. Imagine walking into your next interview confident with this new-found knowledge.
Unfortunately, many beginner data analysts simply don’t bother:
- They don’t take the time to put themselves in a manager’s shoes
- They don’t realize how important it is to think ahead
- Slap together random tutorial projects
- Projects that don’t include key skills
Shortcut the interview process by thinking like a manager.
Put yourself in a hiring manager’s shoes:
- A long list of responsibilities
- Projects to deliver
- People to please
Managers WANT to hire talented data analysts. It’s their job. In an ideal world, the very first person they interview for a job would be perfect.
You can increase your chance of being that “very first person” by learning the skills they want to see.
Here’s how
1. Data Processing
As a data analyst, you will spend a lot of time cleaning and preparing data to get it ready for analysis.
This is a key skill that will lead to faster and more accurate data analysis. But it’s a skill that can be developed. You can use a tool like Excel, SQL, or Python for data prep and cleaning.
Common data processing tasks:
- Filling in missing values
- Blending two data sources together
- Removing duplicate records from a dataset
Mentioning data processing as part of your portfolio projects is a great idea because it shows that you can work quickly with data to answer questions.
2. Quick Insights
Answering questions and solving problems is a data analytics superpower.
Being able to do so quickly, is next level. Your coworkers and colleagues are more likely going to ask you for help if you know how to work with data, develop some insights, and do it all quickly.
Some examples of quick insights:
- How many records are in the data set?
- Any glaring issues or problems with the data?
- Are there obvious categories in the data set?
When you get a new data set, focus on answering some high-level questions using basic business math as quickly as possible.
3. Basic Business Math
Data analysts need basic business math skills to be effective.
Many beginner analysts start off with learning a lot of statistics. But this is a mistake. You don’t need to know advanced formulas for 99% of the business problems out there.
You can do a lot with simple add, subtract, multiply, and divide operations.
Specific examples might see in a typical sales analytics role:
- Year Over Year: How many items were sold this week compared to the same week last year?
- Month Over Month: How many items were sold this month compared to last month?
- Year To Date: How many items were sold from January 1 through today?
- Month To Date: How many items were sold from the first of the month through today?
- Average Sale Price: Number of items sold / total sales
There are many more, but they all have one thing in common: simple business math.
You simply don’t need advanced statistics for most data analytics roles.
Being able to share these concepts in a visual way in your data analytics portfolio shows that you can think through a data set and produce something valuable.
4. Data Visualizations
With data, showing is often better than telling.
When I started in data analytics, I rarely used data visualization. Don’t make the same mistake I did. Using a tool like Tableau (or even Excel) you can create a visualization to help paint the picture for your audience.
6 simple data visualizations that work:
- Bar charts
- Line charts
- Scatter plot
- Slope chart
- Highlight tables
- Maps
These 6 data visualizations are plenty to get started. Sure, there are more advanced options too.
By visualizing the data, you’ll be able to put together a singular story to drive your points home.

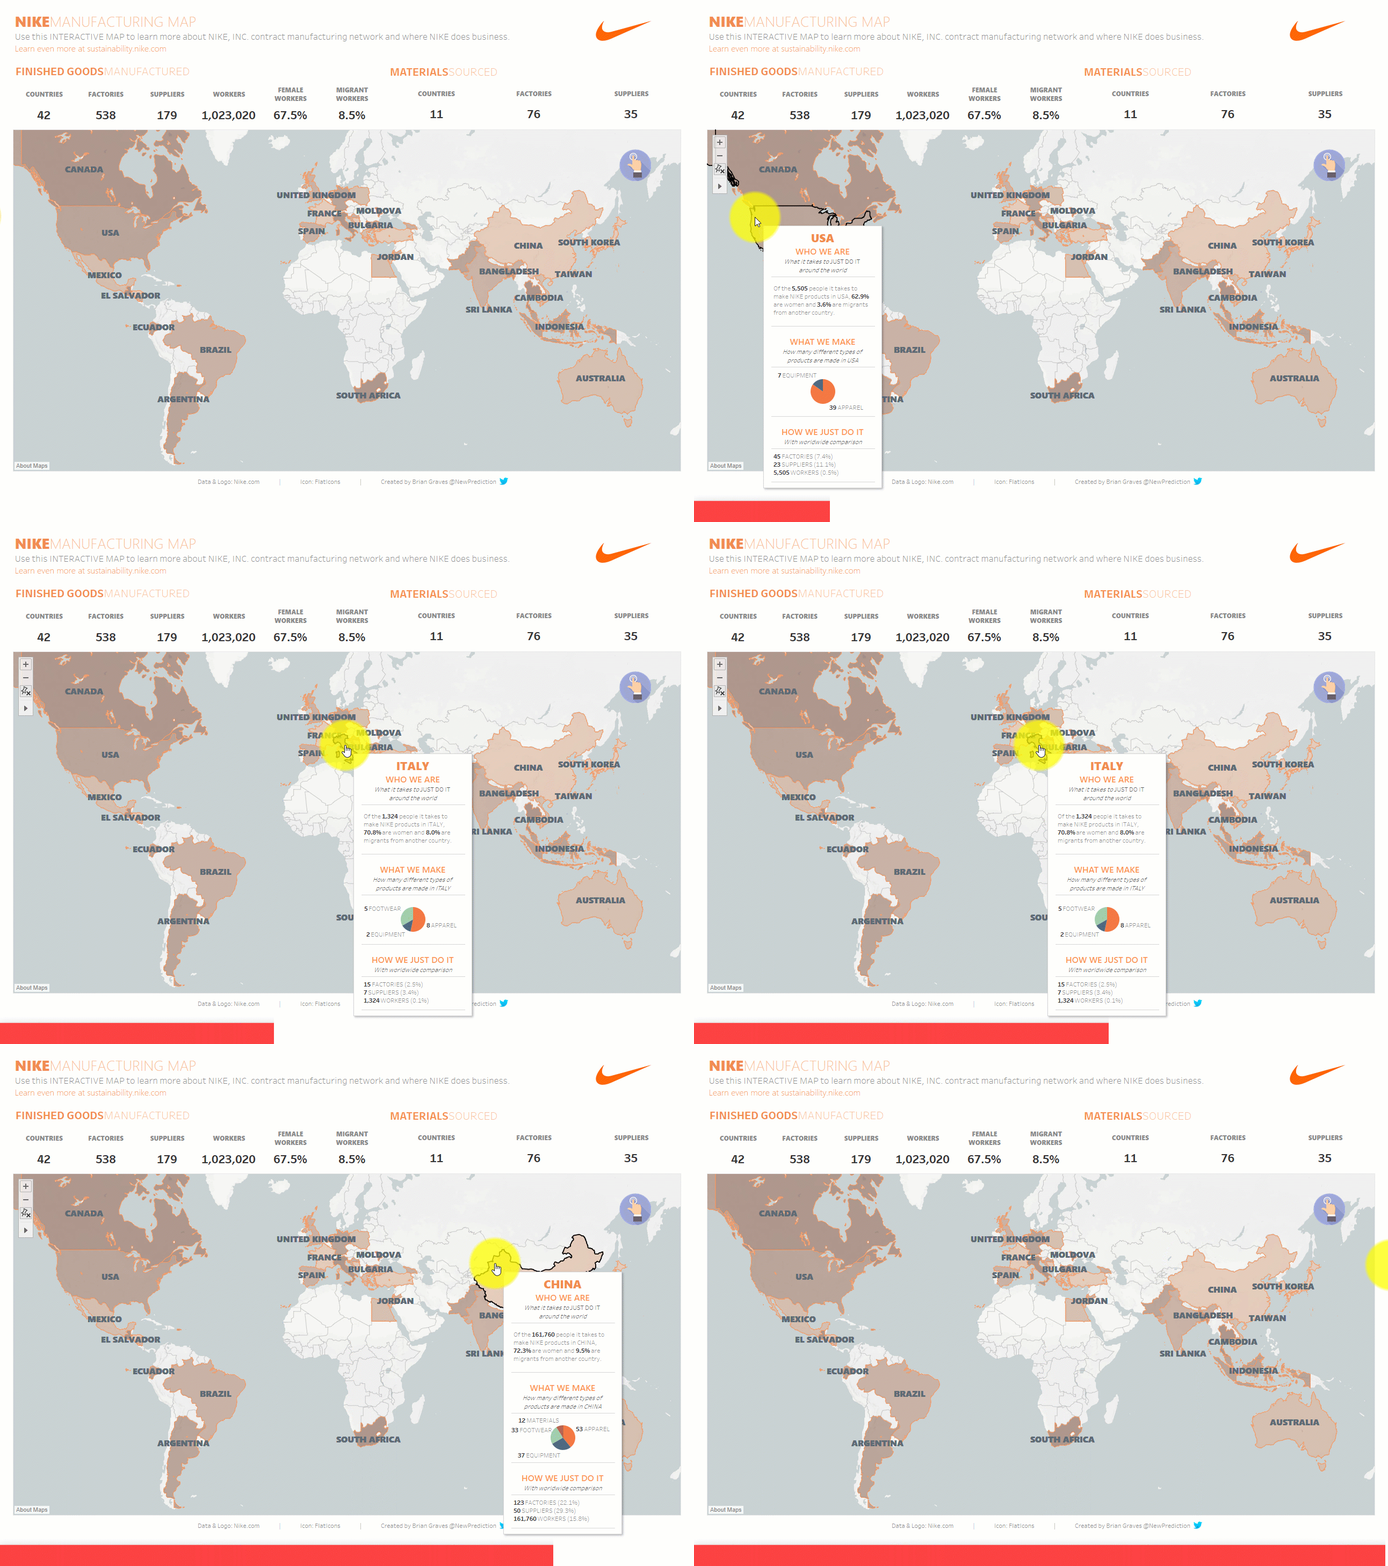
Interactive Nike Manufacturing map from my portfolio
5. Dashboards & Reports
Once you have a few data visualizations, you can combine them into dashboards and reports.
By creating data dashboards and reports, you are able to package up your insights into a single package that’s easier to read and respond to.
Including examples of dashboards and reports in your portfolio shows that you can work with data and actually produce something that can be used to drive decisions.
6. Data Storytelling
Being able to tell a story with your data is one of the skills that sets experienced data analysts apart from the rest.
Everyone loves a good story. And your boss and coworkers are no exception.
Every data story has the same components:
- Characters: who is impacted by the data?
- Setting: what’s the context of your analysis?
- Conflict: what’s surprising about what you found?
- Resolution: what needs to be done next?
Framing your portfolio projects shows employers that you can think through issues from beginning to end.

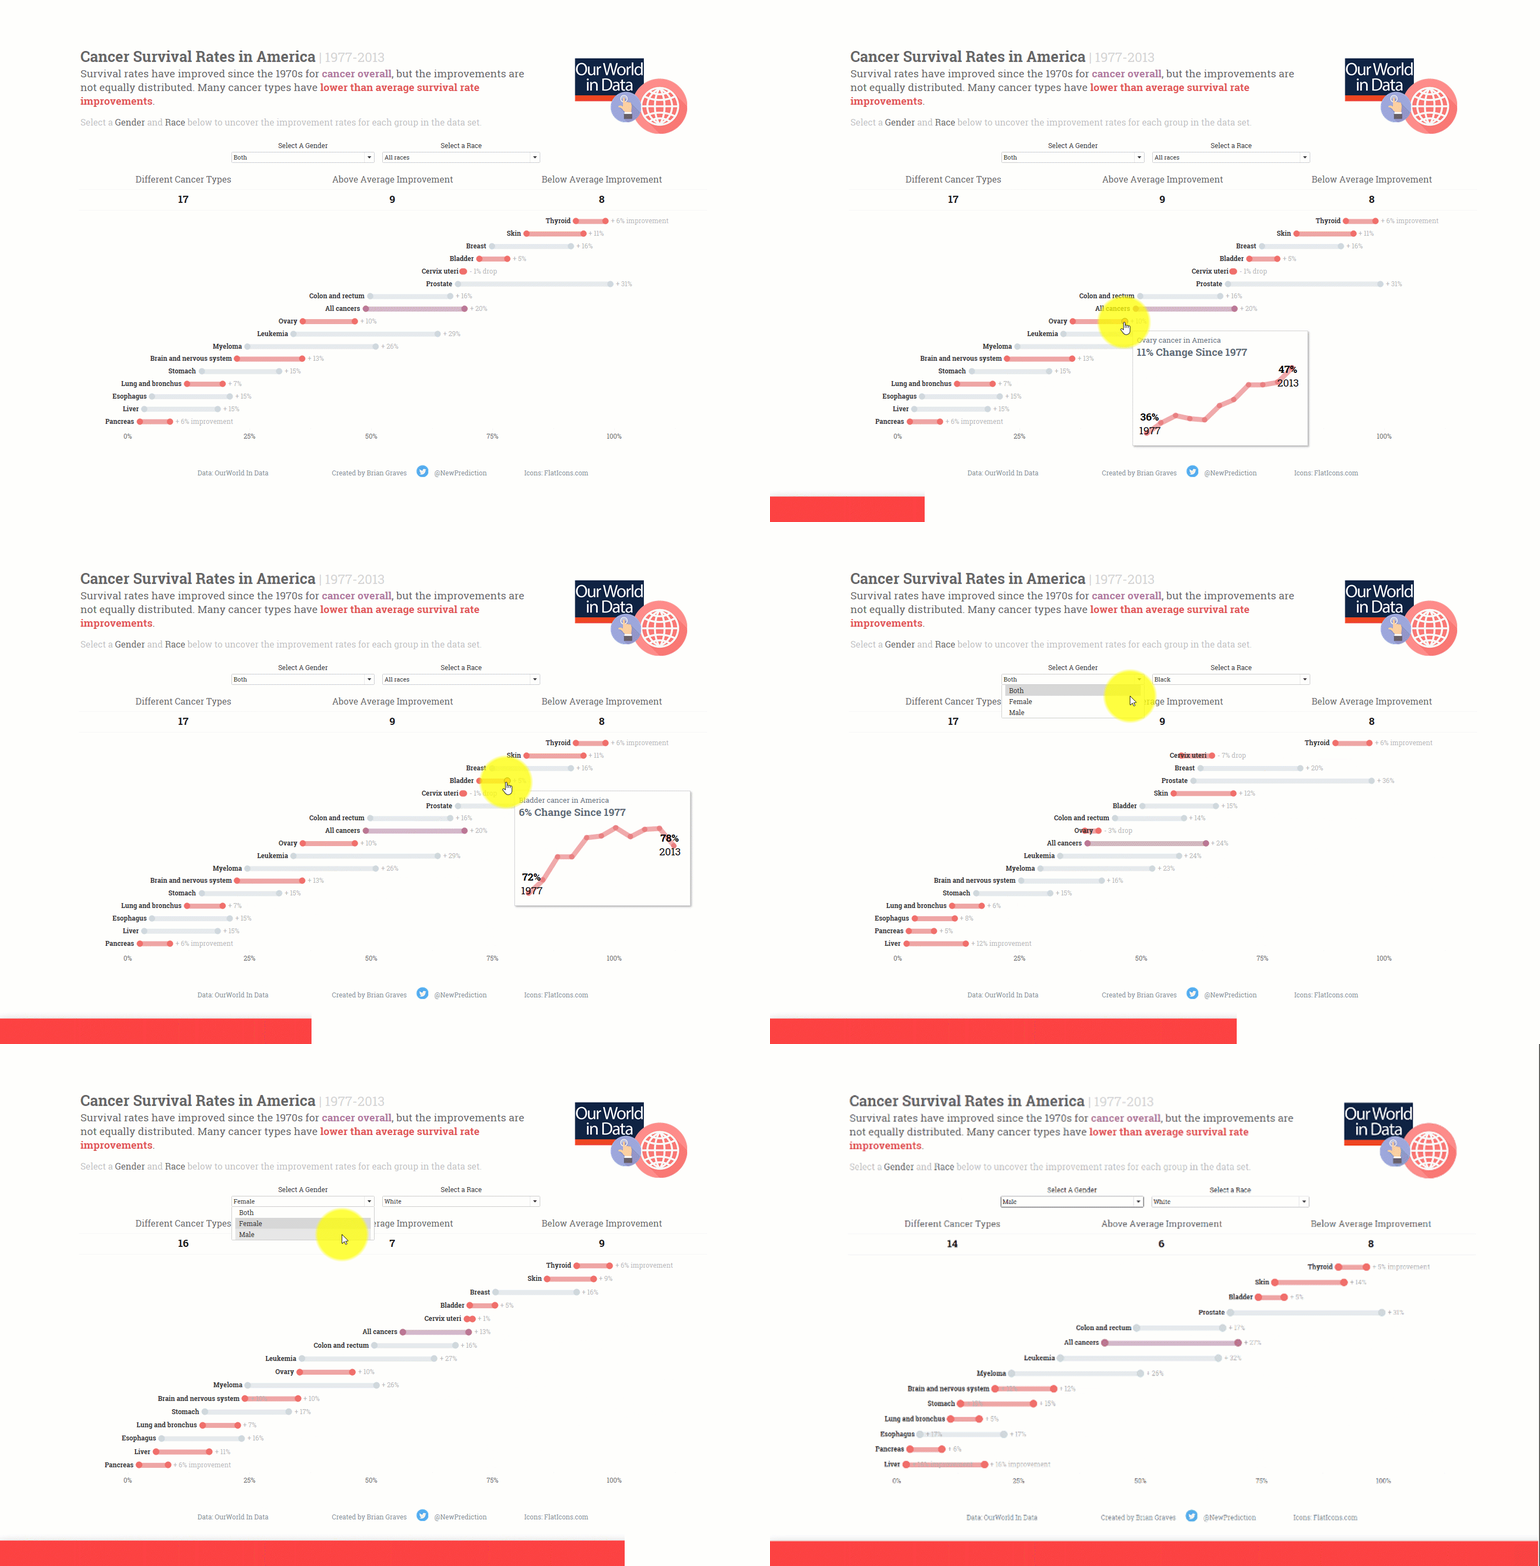
Interactive Cancer Survivor Rates dashboard from my portfolio
7. Critical Thinking
Critical thinking is the ability to work through problems with creativity, curiosity, and logic.
That might seem like a hard task, but it’s a skill that can be learned.
The 3 components of critical thinking:
- Creativity: Use data in creative ways to analyze a sales problem that nobody has thought of yet.
- Curiosity: Create “What If” scenarios to show different outcomes based on different calculations.
- Logic: Be able to back up any solution you propose or insight you come up with.
Thinking critically about problems is the first step to being able to solve them and these are great elements to add to your online data analytics portfolio.
8. Problem Solving
Data analysts solve problems with data every single day.
One of the things I love most about data analytics is solving problems that are really complex and difficult. It’s a skill that can be learned, too.
6 basic types of problems to solve with data
- Predicting something
- Understanding patterns
- Putting things into categories
- Uncovering themes in a data set
- Making connections between ideas
- Drawing attention to something unusual
Being able to apply your experience to a data analytics project and solve real-world problems is a must-have skill and something you’ll want to include in your data analytics portfolio.
9. Domain Expertise
Having experience or expertise should be highlighted in your data analytics portfolio.
For example, if you have worked with sales and marketing data, make sure your portfolio includes examples on that topic. Same thing goes for other industries like healthcare, service, or supply chain analytics.
Getting specific with your data analytics portfolio will help it stick out in the interview process.
Many beginner data analysts overthink this. Impostor syndrome sets in and it’s easy to think “I’m not an expert in anything”. However, you can build up domain expertise in different ways.
How to build domain expertise as a beginner data analyst:
- Volunteer at a non-profit: build business dashboards for a local non-profit to understand their operations
- Focus on one domain: instead of building 5 different dashboards on 5 different topics, pick ONE topic that interests you (like sales for example) and create a different analysis based on different sales data sets
- Participate in community projects: community data projects offer many real-world data sets and have entire communities that you can connect with to get feedback and input.
- Collaborate with others: if you have a coworker or colleague that has more experience than you do, start a conversation and offer to help them in some way.
Showing your expertise lets employers and recruiters know that you are able to solve problems in specific areas of business.
10. Collaboration
Data analysts work as part of a larger team.
And it’s critical to be able to work alongside other people every day to solve problems. If you are determined to work alone, you will not last long as a data analyst.
There are many people you need to collaborate with as a data analyst:
- Data engineers to source the data and get access
- Data scientists for machine learning and AI applications
- Business analysts to understand business problems at a deeper level
- Fellow colleagues and coworkers across different teams and business units
Collaboration is a soft skill that really goes a long way in your career. Be sure to mention it along with other skills and projects to send a signal to recruiters and employers that you work well with others.
That’s it!
Here are the 10 skills that employers are looking for. Be sure to include elements of each in your online data analytics portfolio to help you stand out from the crowd.
- Data Processing
- Quick Insights
- Basic Business Math
- Data Visualizations
- Dashboards & Reports
- Data Storytelling
- Critical Thinking
- Problem Solving
- Domain Expertise
- Collaboration
See you again next week!
Whenever you’re ready, there are 2 ways I can help you:
- How To Create An Awesome Online Data Analytics Portfolio
Preorder and save 25%. You get the full version when it’s complete. - Need specific advice? Book a 1:1 session with me.

Pingback: Data Analytics Freelancing: 5 Simple Steps To Get You Started (Based On My Own Experience) - New Prediction
Pingback: The Hidden Threat: Unmasking Business Fraud Patterns with SQL (Quick Start Guide with Sample Code Included) - New Prediction
Pingback: The 6 Simple Steps to Creating an Interactive Auto Insurance Claims Dashboard with Python and Dash (Code Included) - New Prediction
Pingback: From Data to Decisions: The Step-By-Step Introduction to Crafting Executive Dashboards with Python & Plotly Dash (Code Included) - New Prediction